Table of contents
Table of contents
Construction data analytics connects field operational activity with financial results in a single dashboard, showing cost variance by phase while projects are live. You see which sites or contracts are moving margin and cash out of forecast at the project, phase, and entity levels.
That visibility gives you time to act, so variances don't become write-offs, and your finance teams don’t have to delay supplier payments, step up collections, or use credit to cover a shortfall. This data can yield significant long-term cost savings.
In fact, a Forrester study commissioned by Intuit found that firms can recover an average of $193,974 in revenue by combining their financial and operational data to accelerate decision-making.
Below, find out the two key types of construction data analytics dashboards that matter most for construction firms and how to intervene earlier on active projects that are moving off plan.

What is construction data analytics?
Construction data analytics connects field operations data like labor, equipment, and materials with financial accounting in real time, so you can monitor cost variance by phase, work-in-progress (WIP), and cost-to-complete status while a project is live.
Instead of relying on spreadsheets and period-end rebuilds, you can track both metrics on your dashboard by project, phase, and entity. This matters because accurate WIP allows you to reconcile site progress against the forecast.
For example, if Phase 2 concrete runs 10% over estimate, you see the cost variance in your WIP dashboard this week, not at month-end close. Left unchecked, that overrun compresses your project margin and brings forward cash commitments you haven't planned for. The earlier you see it, the more options you have.
If WIP is wrong, your revenue recognition, cost-to-complete, and group forecast are wrong, too. This is a key mistake that prevents growth in many construction firms. Sureties use WIP accuracy as a risk signal, so unreliable WIP can reduce bonding headroom and limit the projects you can bid for.
One study found that 86% of construction firms collect financial and operational data. The 33% who act on it have an advantage because they spot cost and billing issues sooner and intervene while projects are ongoing.
Intuit Enterprise Suite connects field capture to job costing and reporting without manual re-entry, so PMs and finance work from the same numbers. This reduces the lag between site updates and financial reporting.

AI in construction helps your teams spot patterns across similar contracts, so you can predict where cost-to-complete may drift before it shows up in period-end results. Use it to prioritize which projects need a closer review this week, based on early cost and productivity signals. use their ERP to run gap analyses as a way of comparing their current workflows against how they’d want them to be in an ideal future. The goal is to identify what you’re missing now to reach that future state.
The two key types of data dashboards for construction groups
For CFOs, dashboards provide an operating view of liquidity and contract performance across the group, covering what has happened so far and what is likely to happen next.
You get both through two types of dashboard views, descriptive and predictive analytics:
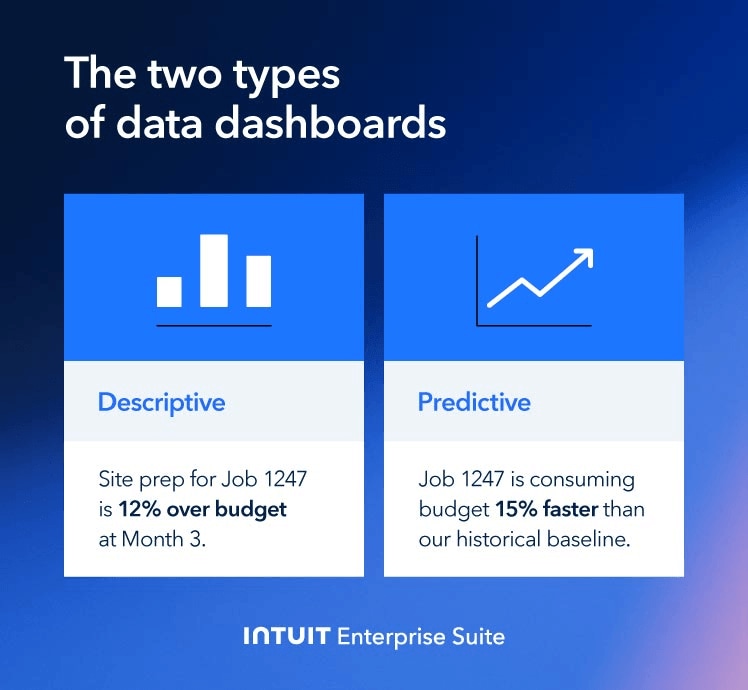
Descriptive analytics
The margin gap between average and best-in-class construction firms is significant. Descriptive analytics helps you find where that gap comes from, giving you visibility at the phase level on when jobs start running over estimate and whether the variance is recoverable.
The CFMA Construction Financial Benchmarker reported an industry-average gross margin of 14.8%, compared to 21.8% for best-in-class firms.
When site prep on Job 1247 runs 12% over budget in month three, you see it in the dashboard, not in the close report in month five. You can compare labour hours per square foot across crews to identify where labour productivity is lagging.
Intuit Enterprise Suite allocates labor costs from Payroll and Time to specific projects, so you can compare planned hours to actuals and calculate productivity measures such as man-hours per unit.
It also supports automated revenue recognition, with rules-based scheduling and journal entries posted to the general ledger based on your specific configured logic (such as percentage-of-completion or milestone-based). This provides a real-time view of billed-versus-earned positions.
This also links labor, billing, and revenue treatment back to the source activity in one view, so your WIP reviews and forecast updates are consistent across the group.
Predictive analytics
Predictive analytics works best when forecast models reflect what’s happening on site, not just tender-stage figures. FMI’s Project Management Study found that margin target hit rates rise from 55% to 78% when financial forecasts incorporate project-level data feeds and PMs are involved in the estimation process.
You can forecast the next 13 weeks’ cash requirements based on current project burn rates and retainage release schedules. This helps you plan working capital allocation, rather than making funding decisions under time pressure.
Intuit Enterprise Suite tells you when a project is consuming budget 15% faster than the historical baseline, so you can prioritize the contracts most likely to miss the forecast.
Use those signals to choose the least disruptive action. Accelerate a billing milestone, redeploy resources from a project ahead of schedule, or, if necessary, prepare a credit line for periods when working capital may be tighter.

When you schedule a demo, you agree to permit Intuit to use the information provided to contact you about Intuit Enterprise Suite and other related Intuit products and services. Your information will be processed as described in our Global Privacy Statement.
How to utilize data findings within the business
Analytics protects your bottom line when it has the power to shape company decisions. For CFOs, that means using the same numbers to steer every stage from initial bidding to monthly project reviews and forecast sign-off.
To do that, focus on five operating areas:
Optimize the bidding process
Contractors routinely add an average of 8% to their bids to protect themselves against slow payments. Experience tells them money often comes in later than promised, so charging more lets them account for the financing cost and uncertainty.

Use findings from past jobs to price new construction contracts more realistically. For example, if certain project types keep running 10% over on site prep, build that buffer into your future bids. Construction analytics helps you spot those repeat overruns by phase, meaning they become expected and manageable assumptions instead of one-off problems.
This moves you from gut-feeling bidding to data-backed pricing at a sustainable margin.
Manage margin fade
FMI’s Project Management Study found that only 2.5% of firms report that projects consistently finish on time and on budget. For you, this shows up as margin fade. Projects that looked profitable early now look thin for reasons like scope change and higher-than-forecast labor costs.
Live WIP reporting, a key feature of construction business intelligence software, provides the data you need to run short, regular reviews while there is still time to steer a project back to forecast. This is how you manage the middle and prevent end-of-project margin surprise.
For example, WIP shows labor cost is spiking in Phase 2, so you agree on a course correction with the PM for Phase 3. That might mean renegotiating a subcontract package when the scope or site conditions have changed, or redeploying labor from a blocked site while waiting for materials to arrive or a site inspection.
The earlier you make the call, the more likely the project is to finish as forecast.
Improve subcontractor and vendor negotiations
FMI’s Project Management Study also found that firms with effective change-order management report 87% profit reliability, compared with 64% for firms without it.
Use project analytics from previous jobs to build a "Subcontractor Scorecard". Examine the frequency and value of change orders, reworks, call-backs, and schedule variance in days. At the procurement stage, this can justify selecting a higher bid from a subcontractor with a track record of greater reliability and budget adherence.
This also gives you leverage during negotiations. Shift negotiations away from day rates toward a more predictable total project value. This way, projects face fewer disputes, and you’ll have a better chance of delivering the margin you underwrote when you signed off on the bid.
 Tip
Tip
Automation in construction accounting reduces the manual handoffs that create timing gaps between site activity and finance reports. Use it to standardize time capture, purchase orders, and billing updates so WIP and forecasts stay consistent across entities.
Refine resource allocation
Seventy-four percent of equipment owners rented additional equipment in the past 12 months, according to an EquipmentWatch survey.
Construction data analytics identifies underused machinery that you sell to raise capital or divert to other sites to avoid renting what you already own. It also shows when you are paying depreciation and maintenance on owned equipment while also paying rental fees.
For example, if your dashboard shows a backhoe is only active 20% of the time on Job A, you could move it to Job B to avoid a second rental and reduce idle cost at the same time.
This helps you free up working capital by cutting rental spend, reducing idle costs, and ensuring owned assets are deployed where they generate revenue.
Empower project managers
The likelihood of hitting profit margin targets rises from 55% to 78% when project managers are at least moderately involved in estimating, according to FMI’s Project Management Study. To enable this, create role-specific dashboards that allow PMs to see the financial impact of their daily field decisions.
They use these dashboards to track hours used versus plan, how their estimate of what it will cost to finish has changed since the last review, and what they've billed versus what they've earned.
The goal is not to turn PMs into accountants but to make them accountable for gross profit and completion dates. Set up monthly project reviews where PMs present their
- Inputs: current WIP, cost-to-complete, billing position, and the top two variances by phase
- Project summary: what changed, why it changed, and what will be different next month
- Get-well plan: what they propose to do to bring the project back on forecast
Then, if you’re in agreement, approve the plan and adjust forecast assumptions, or involve colleagues to, for example, renegotiate a supplier deal or allocate extra QS time to rework cost-to-complete and the billing plan.
Construction data analytics works best when you make the PM as invested in gross profit as they are in the completion date. The upside is more dependable forecasts and fewer late surprises across the portfolio.
Common challenges with implementing a data-first culture
Implementing a data-first culture is challenging when some employees believe it will undermine their judgment and autonomy. They need to believe it will build on their experience, not replace it or second-guess them.
Here’s how to win support from colleagues and the board:
Getting company buy-in
Start by presenting financial data to PMs in a way that helps them understand and manage their crews better. For example, they may tune out with enterprise accounting language but grasp an insight like 'you've used 80% of your labor budget with 60% of the scope complete' much better.
The fastest way to shift the "we've always done it this way" mindset is to deliver a quick win that removes friction. Start with payroll accuracy and materials tracking. Demonstrate how time logs to the right part of a job so the labor report lines up with what they saw on site. Or when materials are booked to the right job, costs stop appearing later in the wrong place.
Construction data analytics reduces friction between you and PMs by giving you both the same view of progress, cost, and billing, using metrics both sides recognize.
Example: The dashboard shows the PM that labour hours per unit are running higher than on similar past projects. It also shows the cost-to-complete is rising each week, even though the schedule looks on track.
The PM changes the plan to stop the crew from bouncing between tasks by grouping work and fixing a materials delay. In the next review, hours per unit stabilize, and the cost-to-complete starts heading back in the right direction.
Tip
Recent construction technology trends include the wider use of cloud and mobile tools so that site and office teams work from the same project data. They also include connected equipment and analytics that track utilization and performance, plus tools like drones and 5D BIM that link progress, time, and cost to project decisions.
Navigating costs
“Data leaders” in the construction sector see a 50% increase in average profit growth rate versus “data beginners”, according to Deloitte Access Economics.
These companies have moved past the idea that advanced analytics needs a $50k+ legacy ERP. Instead, they see how a 1-2% improvement in margin visibility pays for the software in a single project.
Construction reporting software offers other savings, too. Forrester’s TEI study projects $42,831 in technology cost savings over three years and $193,974 in recovered revenue from better decision-making for a composite organization with the Intuit Enterprise Suite platform.
Use numbers like these to build the case with fellow decision-makers and show a return on investment now and over time.
Example: A civil contractor relies on month-end spreadsheets and routinely discovers rebar waste after the fact. The site supervisor starts tracking material usage and waste rates on their dashboard.
In week two of a new pour sequence, they spot waste climbing and trace it to incorrect cut lists from a subcontractor. The subcontractor fixes the issue before the next delivery, and finance updates the forecast with the lower material cost.

Boost productivity and enhance profitability
Construction data analytics gives CFOs earlier visibility into where margin and cash are moving off forecast and who needs to act on it. Use insights at the bid stage and while projects are underway to protect your margins and improve forecasting confidence.
Learn how Intuit Enterprise Suite connects field and finance data across entities so you can run projects and reporting from the same numbers.
Check out upcoming events and learn more about Intuit Enterprise Suite.

Customer stories

Case study
How FEFA Financial scaled up with Intuit Enterprise Suite (No ERP migration needed)

Case study
Case study: Fire & Ice transforms multi-entity challenges with Intuit Enterprise
October 25, 2024

Case study
Four Points RV Resorts review: Why they chose Intuit Enterprise Suite over NetSuite
October 25, 2024

Construction
Migrating to Intuit Enterprise Suite took 2 hours (with zero disruption) for this aspiring $50M revenue business
April 25, 2025

Case study
Humble House Foods case study: How they improved visibility & simplicity using Intuit Enterprise Suite
September 24, 2025
More product updates

Product update
What’s new in Intuit Enterprise Suite spring 2025
April 1, 2025

Product update
Intuit Enterprise Suite 2025 update: AI agents & automation enhancements
July 22, 2025

Product update
What’s new in Intuit Enterprise Suite November 2025: The AI-native ERP that adapts with your business
November 14, 2025