Table of contents
Table of contents
Business performance dashboards provide a real-time, consolidated view of customizable metrics you use to monitor performance against the forecast. They allow you to review live data by entity, department, project, customer, and line to identify issues affecting profit and working capital.
That level of visibility means you can make better decisions about pricing, resourcing, billing, or collections—and act on them sooner. It can also remove a major barrier for the 45% of leaders who told Intuit their firms have inadequate reporting and analysis capabilities.
Business performance dashboards close the gap between spotting a variance and acting on it. Read on for how companies move from static reporting to AI-powered business performance dashboards, and the five best metrics to track.

Why should your team move from static reporting to decision intelligence?
Eighty-seven percent of business leaders say that manual data entry and reconciliation affected the timeliness of their financial reporting.
For CFOs, real-time signals on a business performance dashboard enable mid-month course corrections rather than managing margin or cash drift at period end. At this point, the remaining fixes are undesirable, such as pushing collections, accelerating billing, pausing spending plans, or accepting a write-off.
Live variance data analytics, paired with plain-language AI explanations, provides current data and context for decision-making across the group. You watch variances build in real time, drill into the underlying cause by entity, project, or cost line, and correct course while the period is still open.
Instead of relying on a reconciled historical snapshot, your view of financial performance stays current throughout the period. This allows you to brief the board with numbers that reflect where the business actually stands today and make decisions based on what's happening now, not what happened last month.
 Cloud ERPs feed dashboards with near real-time data. Without that live connection, your view is only as up to date as your last sync. As a cloud-native ERP, Intuit Enterprise Suite can consolidate information from multiple entities so that every KPI reflects the business's current position.
The anatomy of a high-performance executive dashboard
In Intuit’s survey, 64% of business leaders said they wanted better integration capabilities for their firms. Business performance dashboards deliver that integration by pulling disparate data from your ERP, CRM, and HR systems into a single entity-level view.
This creates a single source of truth across the group business, allowing you to drill from a dashboard total down to its underlying transactions. That traceability makes the data reliable enough to support reports, forecasts, and company decisions.

For an effective high-performance executive dashboard, include the following elements:
- Standardized definitions: Consistent entity and dimension mapping, with shared revenue and cost-line rules
- Five to eight top KPIs: A short list that shows what's on track and what isn't, with supporting metrics one click away
- Layered drill-down: A global health signal that lets you click through to the specific department or project causing a particular trend
- Automated variance analysis: Receive plain-language explanations that prioritize the highest-impact deviations first, detailing exactly why a metric moved.
As CFO, you set the financial rules the dashboard operates by, including the definitions, metrics, and logic. With an agreed framework, board discussions focus on decision-making instead of questioning the numbers.

Best 5 BI dashboards to track business performance
No single dashboard will answer every CFO or business leader's questions. The most effective approach is to build a connected set of views, each one focusing on a specific financial question.
These five dashboards provide the specialized visibility needed to drive enterprise value:
1. Sales performance dashboard to protect margin
Sales performance dashboards provide executive oversight into predictive win probability, sales velocity, and forecast reliability. These statistics measure the success and health of the company’s revenue engine.
Track customer acquisition cost (CAC) at the headline level, then drill into it by segment to find where acquisition costs are eating into margin. If one client type costs far more to win but delivers lower contract value, profit, and retention, you're buying revenue at the expense of profit. That's data you can bring to the next budget review.
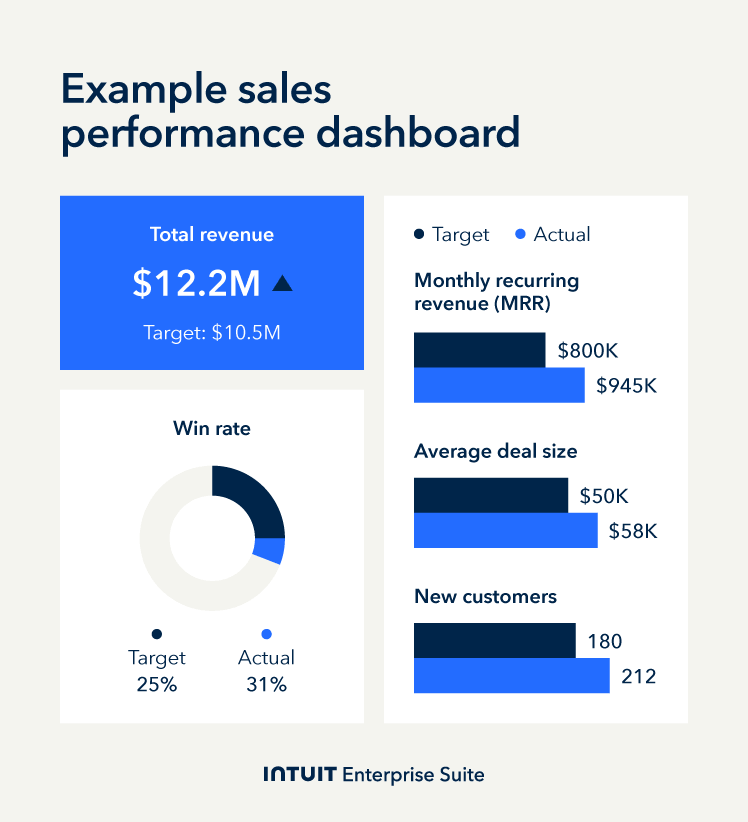
Monitor sales forecast accuracy over time. If the figures aren't reliable, identify what's causing the variance by product, rep, segment, or deal stage. Then tighten revenue assumptions so the board gets a forecast it can actually commit capital against.
Example: A multi-site construction firm compares CAC by project type and finds that commercial renovation deals cost 2.8 times more than residential projects, with similar contract values. The CFO restricts further investment in the high-cost channel until the sales team closes the cost-per-deal gap.
2. Financial overview dashboard for predictive cash flow
The financial overview dashboard monitors liquidity and high-level fiscal health using metrics such as net profit margin, working capital, and cash flow forecasts. This gives you an at-a-glance view of whether the company meets its obligations, funds growth, and sustains profitability.
One key feature is AI-generated variance narratives. The BI software identifies and analyzes variance with a plain-language explanation of why it occurred, whether it's a hike in subcontractor costs, additional overtime, or an unplanned equipment purchase. You have the information to act immediately rather than waiting to investigate.

Use predictive cash flow velocity to stress-test whether you have the capital to fulfill upcoming commitments. If the model identifies a projected shortfall, the CFO can proactively restructure payment terms or secure credit facilities under favorable conditions rather than under duress.
Example: A specialty electrical contractor with eight entities sees its operating margin drop 2.1 points halfway through the month. The AI agent traces it to a fuel surcharge increase from the primary logistics provider, affecting three of the group entities. The CFO instructs procurement to renegotiate the rate or source an alternative before the cost gets baked into the quarterly results.
3. Customer insights dashboard to forecast revenue retention
Customer insights dashboards quantify the long-term value and retention of the company’s client base. Key metrics include lifetime value (LTV), net revenue retention (NRR), and churn health scores. Together, they show you whether you're growing or losing revenue from existing clients.
NRR is a key metric for many mid-sized firms. If it's above 100%, existing customers are spending more over time through upsells and expansions. If it's below, you have a leaking bucket.
Churn rates help you spot at-risk accounts before they leave. AI alerts rank those accounts by revenue exposure and highlight deteriorating engagement patterns, so you set the retention budget and decide the terms you're willing to offer while there's still time to act.
Connect retention data to guide your strategic financial planning. If churn is high for a particular segment or contract type, factor that into your revenue forecast rather than planning on full renewal.
Example: A hospitality management group with 12 properties notices NRR among mid-tier corporate accounts dropped from 91% to 84% over the past two quarters. It happened at the same time they put up rates, but didn't add any value to the package they offered.
The CFO sets a retention budget for the 15 highest-value at-risk accounts and approves the terms the account team can offer, with the aim of protecting $2.3m in annual revenues.
4. Marketing performance dashboard to prove channel ROI
The marketing performance dashboard connects top-of-funnel activity to bottom-line profitability. Important performance indicators include multi-touch attribution, MQL-to-SQL conversion, and return on ad spend (ROAS). These statistics show which channels generate revenue, not just traffic.
Use multi-touch attribution to map the full client journey from first contact to close. This shows which marketing activities contribute directly to revenue and which generate clicks that never convert. When cost per lead shifts, AI-generated variance narratives show which channel caused the change, so you adjust spend based on evidence rather than assumptions.
MQL-to-SQL conversion rates indicate how many leads marketing generates that sales can close. If the leads aren't converting, hold back part of the marketing budget and ask the CMO to show how they'll fix it before the next quarter's spend is approved.
Example: A manufacturing company compares ROAS across channels and finds trade show leads convert at 22% versus 6% for paid search. Average contract values are also 30% higher for trade show leads. The CFO raises the disparity in the next budget review, and the CMO proposes shifting 20% of the paid search budget to trade show sponsorships.
A business capability model maps what your company does, not how it's structured. Overlay KPIs onto areas like "customer acquisition" or "order fulfillment" to spot process problems rather than blame people, and direct investment where it fixes the bottleneck.
5. Inventory management dashboard to unlock working capital
The inventory management dashboard tracks the capital tied up in physical products. Key metrics include inventory turnover, days sales of inventory (DSI), and demand sensing. These statistics show whether stock levels are working for the business or quietly draining cash.
A low inventory turnover means capital is sitting on shelves instead of generating revenue. A high DSI indicates you’re taking too long to convert inventory into sales. With both visible on your dashboard, you can require the supply chain team to justify ordering volumes against turnover targets before surplus stock starts weighing on the balance sheet.
AI-powered demand forecasting analyzes real-time signals like order velocity, seasonal patterns, and supply chain lead times to alert you when stock levels move out of sync with actual customer demand. Use this to challenge procurement before they over-order and to avoid stockouts that delay fulfillment and damage client relationships.
Example: A building materials distributor with six warehouses finds fastener inventory at 68 days on hand, well above the 40-day target. The stock built up after procurement ordered against the original program for a commercial fit-out, but the main contractor pushed the schedule back by eight weeks due to labor shortages.
The CFO suspends new procurement cycles for the category until levels return to target, successfully freeing $180,000 in liquid working capital.
How AI-powered business performance dashboards turn variance into action
Business performance dashboards are a feature of many business intelligence software platforms. They shift BI from monitoring to management and, on financial matters, the CFO makes sure every variance has an owner, an action, and a deadline.
The difference is that you walk into the board meeting already knowing the issues have been addressed, not presenting them for the first time.
Example: A general contractor with 14 entities monitors project margin by job type, noticing a drop from 11% to 7% in one month on commercial tenant improvement projects. The CFO identifies the reason as discretionary discounts on three larger tenders to win the order.
To protect profitability in the future, the CFO introduces a discount approval threshold that requires sign off. They also work with the sales director to review pipeline pricing to find any other deals where larger discounts have already been offered.
Modern business performance management dashboard solutions support this with four capabilities:
AI-generated variance explanations
Generative AI analyzes your underlying data to provide a plain-language explanation behind a shift alongside the actual number. Instead of a solitary alert showing a 2% drop, it also explains why, such as a spike in shipping costs across three entities. Get straight to the reason and act to contain the cost before it compounds.
Pinpoint where margin is leaking
Margin typically leaks through sales, operations, or finance. Isolate the responsible area by comparing actuals against forecast at the cost-center level. Then alert the metric owner to fix it and report back by a set deadline.
Move from insight to execution
Margin loss lives in the gap between discovery and action. Enterprise business intelligence dashboards now integrate configurable workflow automation directly into the dashboard.
Rather than waiting for a monthly review, the system detects deviations based on your predefined thresholds and routes a diagnostic task to the responsible project manager. This means that a project manager can address a job that's running over budget immediately—not at the next meeting.
Manage by exception
Assign tolerance bands to focus on more substantial KPI shifts. Set your business dashboard to alert the owner when the metric moves outside its zone, prompting corrective action. Intuit Enterprise Suite's Finance Agent supports this by displaying KPIs with the highest variance first and providing next-action recommendations, so you focus on the issues that affect margin most.

When you schedule a demo, you agree to permit Intuit to use the information provided to contact you about Intuit Enterprise Suite and other related Intuit products and services. Your information will be processed as described in our Global Privacy Statement.
Boost productivity and enhance profitability
The shift from static reporting to live business performance dashboards changes what a CFO controls. Business performance analytics let you set the rules, monitor the metrics, and ensure the right people are fixing the right problems in real time. That's less of a reporting upgrade—and more a different way of running the business.
Schedule a call with the Intuit Enterprise Suite team today. Monitor performance across every entity with consolidated dashboards, AI-powered variance narratives, and real-time profitability tracking from a single view.
Check out upcoming events and learn more about Intuit Enterprise Suite.
Customer stories

Case study
How FEFA Financial scaled up with Intuit Enterprise Suite (No ERP migration needed)

Case study
Case study: Fire & Ice transforms multi-entity challenges with Intuit Enterprise
October 25, 2024

Case study
Four Points RV Resorts review: Why they chose Intuit Enterprise Suite over NetSuite
October 25, 2024

Construction
Migrating to Intuit Enterprise Suite took 2 hours (with zero disruption) for this aspiring $50M revenue business
April 25, 2025

Case study
Humble House Foods case study: How they improved visibility & simplicity using Intuit Enterprise Suite
September 24, 2025
More product updates

Product update
What’s new in Intuit Enterprise Suite spring 2025
April 1, 2025

Product update
Intuit Enterprise Suite 2025 update: AI agents & automation enhancements
July 22, 2025

Product update
What’s new in Intuit Enterprise Suite November 2025: The AI-native ERP that adapts with your business
November 14, 2025