Table of contents
Table of contents
Key takeaways:
- Liquidity ensures your business can meet immediate obligations like payroll and supplier payments, maintaining smooth daily operations.
- Without sufficient liquidity, even profitable companies can face operational disruptions.
- Solvency reflects your company's ability to meet long-term debts, indicating financial stability and sustainability.
- A solvent business is more attractive to investors and lenders, facilitating growth opportunities.
Running a business can feel like spinning plates. There’s always money going out. To stay afloat, you should be ready to handle any major unexpected expenses without breaking the bank. According to a recent QuickBooks survey, 46% of US small businesses report experiencing cash flow issues, highlighting the importance of having your financials in hand.
That’s where understanding liquidity vs. solvency comes in.
Knowing the differences between these two concepts can help you manage your finances, plan better, and avoid surprises. Learn what liquidity and solvency mean, how they affect your business, and which one matters most in different situations.

What is liquidity?
Liquidity is having enough cash, or assets you can quickly turn into cash, to pay your immediate bills. It’s about covering day-to-day needs and any surprise costs without stress.
Key liquid assets include cash on hand, accounts receivable, and short-term investments because you can quickly use or convert them into usable funds.

Liquidity ratios and other metrics
Liquidity ratios and related metrics comprehensively assess your business's ability to meet short-term obligations. Analyzing these indicators can help you assess how effectively your company manages its cash flow and working capital.
Understanding the interplay between these metrics helps identify areas for improvement and ensures financial stability.
Here are four of the most crucial liquidity metrics:
Current ratio
A healthy current ratio generally shows you can cover short-term debts using your available assets. Benchmarks can vary by industry, so compare your ratio to peers.
The formula is:
Current ratio = Current Assets ÷ Current Liabilities
 While the general standard for a current ratio is 1.5 to 2.0 current ratio is 1.5 to 2.0, this can differ by industry.
For example, the biotechnology industry often has average current ratios above 5.0, reflecting substantial research and development investments. In contrast, the airline industry typically operates with ratios below 1.0 due to high fixed costs and capital expenditures.
Quick ratio
This quick ratio is a more conservative measure because it assesses the liquidity of inventory, which can take time to sell. Here's the formula:
Quick Ratio = (Current Assets - Inventory) ÷ Current Liabilities
This calculation is critical for businesses with slow-moving stock or seasonal inventory because it assesses their ability to meet short-term obligations without relying on inventory sales.
Days sales outstanding (DSO)
Days sales outstanding measures the average number of days it takes to collect payment after a credit sale. A lower DSO indicates efficient collections and healthier cash flow, while a higher DSO may signal potential liquidity issues.
Monitoring DSO helps you manage your accounts receivable effectively and maintain steady cash inflows.
Cash flow
Positive cash flow means more money is coming into your business than going out. Consistent cash flow lets you meet daily obligations, from automatic payroll processing to rent.
Tracking cash flow with tools like Intuit Assist gives you strong business intelligence and helps you spot the opportunity cost when choosing projects.
What is solvency?
Solvency is your company’s ability to meet its long-term financial obligations and stay in business over the long haul. It hinges on the relationship between assets, liabilities, and equity. Generally, a solvent company has more assets than liabilities, showing solid equity value in its capital structure.

Solvency ratios
Solvency ratios help assess your business's ability to meet long-term obligations and maintain financial stability. Analyzing these metrics allows you to evaluate how effectively your company balances debt and equity to support sustainable growth.
Understanding these ratios is crucial for making informed decisions about financing and investment strategies. Here are four of the most important solvency metrics.
Debt-to-equity ratio
The debt-to-equity ratio indicates how much a company relies on borrowing versus owners’ investments to fund its operations. Here's the formula:
Debt-to-Equity Ratio = Total Debt ÷ Total Equity
A lower debt-to-equity ratio generally suggests a more solvent and less risky financial position.
Debt-to-assets ratio
The debt-to-assets ratio shows what percentage of your company’s assets are financed through debt. A lower ratio typically indicates lower financial risk and higher solvency. The formula is:
Debt-to-Assets Ratio = Total Debt ÷ Total Assets
A debt-to-assets ratio below 0.5 often signals a strong solvency position, though ideal levels vary by industry. Capital-intensive sectors like utilities operate with higher ratios, while technology firms typically maintain lower ones.
Interest coverage ratio
The interest coverage ratio assesses how easily your company can pay interest on its outstanding debt. The formula:
Interest Coverage Ratio = Earnings Before Interest and Taxes (EBIT) ÷ Interest Expense
A higher ratio indicates stronger financial health, suggesting sufficient earnings to comfortably cover interest payments. Conversely, a ratio below 1.5 may signal financial stress and a limited ability to meet obligations.
Equity ratio
The equity ratio is total equity ÷ total assets, reflecting the proportion of your company’s assets financed by owners’ equity.
A higher equity ratio generally signifies greater solvency and financial stability. Comparing your firm’s equity value to its enterprise value can also highlight the role of equity in funding long-term growth.

When you schedule a demo, you agree to permit Intuit to use the information provided to contact you about Intuit Enterprise Suite and other related Intuit products and services. Your information will be processed as described in our Global Privacy Statement.
Liquidity vs. solvency: Key differences
There are many differences between liquidity and solvency. For instance, liquidity ratios act as early warning signs when working capital runs low, while solvency ratios reveal your reliance on debt versus owners’ equity over time. Monitoring both sets of KPIs gives you actionable business intelligence to avoid danger on both fronts.
What to consider when using liquidity and solvency ratios
Liquidity and solvency ratios are essential tools for assessing your company's financial health. However, their effectiveness depends on proper context and interpretation. Here are key considerations to ensure accurate and meaningful cash flow analysis.
Comparisons should be equal and relevant
It's crucial to compare your company's ratios with industry peers to obtain a realistic performance assessment.
Financial ratios become more significant when compared to appropriate benchmarks. Ideal ratios can vary widely across industries due to differing business models and capital structures. For instance, a high debt-to-equity ratio might be typical in capital-intensive sectors like utilities but alarming in technology firms.
Tracking trends can provide useful insights
Analyzing financial ratios over time reveals trends that single-period snapshots cannot. Monitoring these trends helps identify improvements or deteriorations in financial health, enabling proactive decision-making. For example, a steadily declining current ratio may indicate emerging liquidity issues, prompting timely corrective actions.
This is where a powerful financial reporting platform like Intuit Enterprise Suite becomes essential. With comprehensive data integration and insight generation, it can automatically track financial trends in real-time dashboards, allowing businesses to spot potential issues or opportunities much faster than manual analysis.
Cross-analyzing them is key to understanding the company’s financial health
Evaluating liquidity and solvency ratios in tandem offers a comprehensive view of your company's financial stability. While liquidity ratios assess the ability to meet short-term obligations, solvency ratios evaluate long-term financial sustainability.
A company might exhibit strong liquidity but poor solvency, indicating potential long-term risks despite short-term stability. Therefore, integrating both sets of ratios into your financial planning and analysis (FP&A) strategy provides a balanced perspective on financial health.
Examples of liquidity vs. solvency ratios
Let's examine liquidity and solvency ratios and related concepts using a hypothetical company's balance sheet:
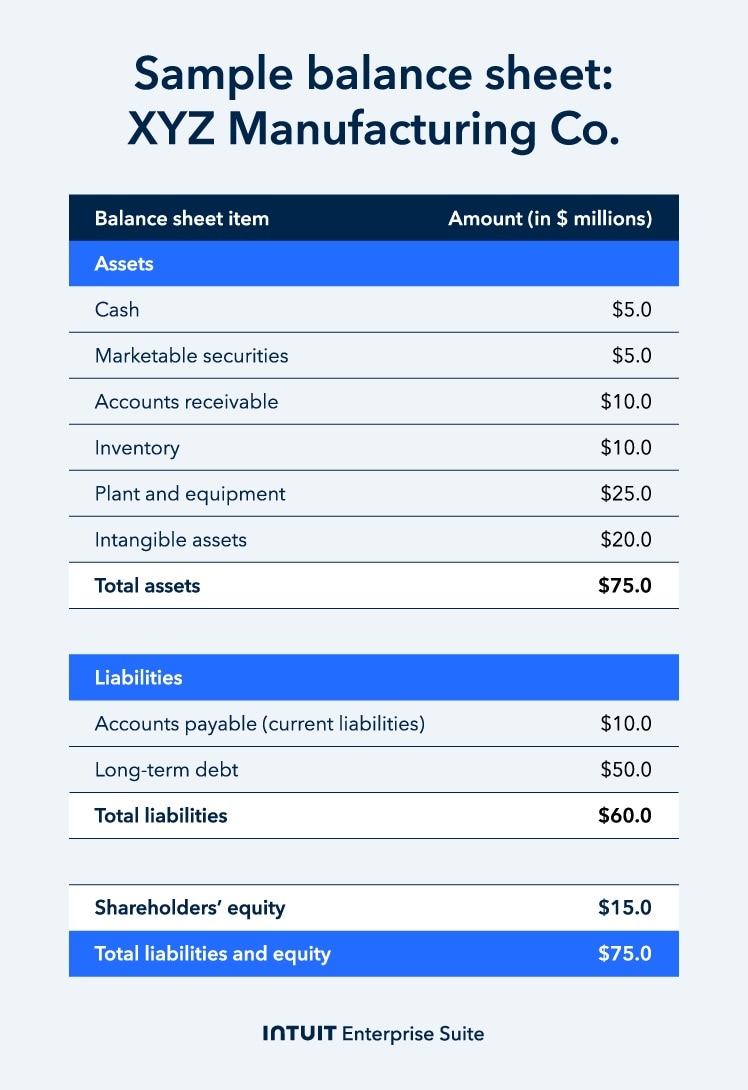
Liquidity ratios
- Current ratio: Current Assets ÷ Current Liabilities = ($5.0 + $5.0 + $10.0 + $10.0) ÷ $10.0 = $30.0 ÷ $10.0 = 3.0
A current ratio of 3.0 indicates that XYZ Manufacturing Co. has three times more current assets than current liabilities, suggesting strong short-term financial health.
- Quick ratio: (Current Assets - Inventory) ÷ Current Liabilities = ($30.0 - $10.0) ÷ $10.0 = $20.0 ÷ $10.0 = 2.0
A quick ratio of 2.0 suggests that the company can comfortably meet its short-term liabilities without depending on inventory sales.
Solvency ratios
- Debt-to-equity ratio: Total Debt ÷ Total Equity = $50.0 ÷ $15.0 = 3.33
A ratio of 3.33 means the company uses $3.33 of debt for every dollar of equity, which may indicate higher financial risk.
- Debt-to-assets ratio: Total Debt ÷ Total Assets = $50.0 ÷ $75.0 = 0.67
A ratio of 0.67 implies that 67% of the company's assets are financed through debt, highlighting significant leverage.
- Equity ratio: Total Equity ÷ Total Assets = $15.0 ÷ $75.0 = 0.20
An equity ratio of 0.20 indicates that 20% of the company's assets are financed by equity, suggesting reliance on debt financing.
By analyzing these ratios, you can effectively measure KPIs, gaining insight into both short-term liquidity and long-term solvency. This comprehensive understanding aids in strategic decision-making and financial planning.
Why both liquidity and solvency matter for your business
Focusing only on liquidity or only on solvency leaves gaps in your financial picture. Your business needs steady cash flow for today’s operations and solid balance-sheet health for tomorrow’s goals. By monitoring both, you protect day-to-day performance and future prospects.
Liquidity for short-term survival and operational efficiency
Sufficient liquidity ensures smooth day-to-day operations by covering expenses like rent, payroll, and supplier invoices on time. It also gives you the freedom to seize opportunities, such as bulk-purchase discounts or sudden market chances. Having a cushion of liquid assets lets you handle unexpected costs swiftly, avoiding expensive emergency funding.
Solvency for long-term stability and growth potential
Solvency provides a solid financial foundation by ensuring assets exceed liabilities over time, which builds confidence among lenders and investors. Strong solvency ratios help you to negotiate with suppliers, broker better loan terms, and attract investment to fund expansion plans.
Maintaining a healthy capital structure also reduces financial risk, allowing you to focus on strategic growth instead of debt concerns.
Think of liquidity as having enough cash in your wallet to get through the week, and solvency as having enough overall assets to cover all your debts in the long run.
How to improve both liquidity and solvency
Strengthening both liquidity and solvency is essential for your business's immediate operations and long-term success. Here are practical steps to enhance them.
1. Optimize working capital management
Efficient working capital management ensures that your current assets and liabilities are balanced, allowing for smooth operations. Implementing systems like job order costing can help track expenses accurately for each project. It leads to better cash flow management and informed decision-making.
2. Refinance high-cost debt
High-interest debts can strain your finances. Consider refinancing options to secure lower interest rates or extended payment terms. This strategy can improve your debt-to-equity ratio. It can also enhance your company's solvency and make it more attractive to investors.
3. Build a cash reserve
Establishing a cash reserve acts as a financial buffer during unexpected downturns or emergencies. Regularly setting aside a portion of profits can help maintain liquidity, ensuring your business can meet its short-term obligations without resorting to high-interest loans.
4. Conduct scenario planning
Regularly performing scenario planning allows you to anticipate potential financial challenges and opportunities. By modeling various financial situations, you can develop strategies to maintain liquidity and solvency under different circumstances, ensuring your business remains resilient.
5. Leverage technology for real-time monitoring
Utilize cash management solutions to gain real-time insights into your financial status. Solutions like Intuit Enterprise Suite offer features such as cash flow analysis, expense tracking, and financial reporting, enabling proactive financial management.

Boost productivity and enhance profitability
Understanding liquidity vs. solvency isn't just clearing financial jargon—it's about ensuring your business can handle current expenses while planning for future growth. By mastering both, you can streamline operations and make strategic business decisions that keep your future secure.
Intuit Enterprise Suite (IES) offers an all-in-one solution to help you achieve this balance. With features like automated financial management, integrated payroll and HR tools, and real-time business insights, it streamlines your operations and supports business growth. Strengthen your financial foundation with Intuit Enterprise Suite today.
Check out upcoming events and learn more about Intuit Enterprise Suite.

Customer stories

Case Study
How FEFA Financial is growing with Intuit Enterprise Suite—without migrating to an ERP

Case Study
How this mission-driven, employee-owned company created efficiencies with Intuit Enterprise Suite
October 25, 2024

Case Study
Why this camping business chose Intuit Enterprise Suite over NetSuite
October 25, 2024

Case Study
Migrating to Intuit Enterprise Suite took 2 hours (with zero disruption) for this aspiring $50M revenue business
April 25, 2025

Case Study
Humble House Foods case study: How they improved visibility & simplicity using Intuit Enterprise Suite
September 24, 2025