Table of contents
Table of contents
When key performance indicator (KPI) definitions vary across entities, the board presentation doesn't reflect how the business is actually performing. Without standardized definitions, recognition rules, and matching reporting periods, the numbers aren't strong enough to support investment and resource allocation decisions.
As firms grow organically and through acquisitions, existing KPIs may no longer reflect the business structure or the location of value creation. Already, 34% of companies use AI to reassess their KPIs, according to an MIT Sloan and BCG study, with 9 out of 10 reporting measurable improvements.
The nine steps below outline how to accurately measure KPI metrics across a multi-entity business and how AI-native systems deliver performance data faster to leadership teams.

1. Standardize multi-entity metrics for consolidated group oversight
At the entity level, your finance leads focus on KPIs such as unit costs and labor efficiency. At the group level, you're focused on profitability, cash flow, and working capital.
Both measure performance, but entity KPIs need to map to group metrics like consolidated margin and return on capital; otherwise, you don't know whether the group is actually on track to hit its target.
And mapping is only half the job. Strong financial governance ensures that every entity calculates those KPIs consistently, using consistent multi-dimensional accounting structures across the group. Without this centralized oversight, local interpretations of expense categories or revenue recognition can render your consolidated reports fundamentally incomparable.
Whenever the business structure changes, such as through an internal reorganization or an acquisition, revisit both the mapping and the calculation rules to ensure they continue to reflect your enterprise strategy.
KPI example: Gross margin by entity. Compare entity-level gross margin against the consolidated number each period. If two entities in the same line of business are reporting materially different margins, the first place to look is whether they're classifying cost of goods sold the same way.

2. Ground board-level targets in predictive historical modeling
KPI targets get challenged by the board, by entity leads, and during audits. You need to show why the number matters and what happens to the business if it's missed.
AI forecasting can, for example, analyze several years of entity-level history to quantify trends and seasonality, using the data you already have. That gives you a baseline for setting KPIs rooted in how the business has actually performed, rather than using external benchmarks or last year's budget plus a percentage.
Set targets at both entity level, reflecting local operating conditions, and group-level, reflecting your strategic financial planning priorities across the portfolio.
When you ground targets in performance, regular reviews focus on variances away from forecast rather than whether the targets were right in the first place.
KPI example: Forecast accuracy (MAPE). Track the variance between your forecast and actuals at entity and group level each period. The FP&A Trends Survey found that 65% of organisations using AI rate their forecasts as good or great, compared with 42% overall.

3. Choose KPIs that expose intercompany and consolidation friction
Operating as a group creates work that doesn’t exist within single-entity businesses. It also adds complexity for firms still running consolidation manually, which makes errors harder to find and delays the close, making the numbers harder for the board to trust.
As your entity count and transaction volumes grow, you need financial KPIs that measure the quality, accuracy, and timeliness of the data flowing between and from subsidiaries.
Three ways to measure entity performance for manual teams need attention:
- How quickly and accurately entities record, reconcile, and eliminate intercompany transactions
- How many manual adjustments your team has to make after entity submissions
- How often intercompany balances agree on first submission
Require entities that repeatedly fail to hit their target to start using your finance team’s spreadsheet templates and reporting formats. Alternatively, mandate that each new entity has to do it at the point they join the group. Even then, your finance team still has to consolidate every submission manually and check for errors before the numbers are reliable enough to base reports on.
Maintaining visibility over multi-entity performance is a manual exercise that gets harder with every entity you add. Until you switch over to a centralized system that automates consolidation, these KPIs are your best tool for knowing where the close process is breaking down.
KPI example: Intercompany matching rate on first submission. Track the percentage of intercompany balances that agree without manual adjustment. When this rate is low, your finance team spends close week fixing imbalances instead of reviewing the consolidated result. A Deloitte intercompany survey found that 30% of companies reported significant out-of-balance positions requiring plugs to reconcile.

4. Pivot to a unified data ingestion model
KPI accuracy depends on how data is collected, standardized, and controlled across systems—not just how it’s aggregated. When subsidiaries operate on disparate charts of accounts (COA) or conflicting revenue recognition rules, the resulting KPIs are fundamentally incomparable.
A unified ERP does this by standardizing how transactions are recorded across entities—using the same chart of accounts, definitions, and reporting rules from the start.
With live data, finance teams can spot errors—like misclassified transactions or intercompany mismatches—as they’re recorded, instead of finding them during month-end reconciliation. When entity-level performance data is centralized, advanced reporting combined with AI-driven validation improves accuracy by alerting you to coding inconsistencies, intercompany mismatches, and duplicate entries.
Consistent, current data gives leadership confidence that the KPIs reflect reality and lets them make decisions backed by numbers the whole group trusts.
KPI example: Days to close. Track the number of working days from period end to signed-off group accounts. This is the clearest measure of whether your data collection method is working. A Cherry Bekaert CFO survey found that 49% of CFOs say poor data quality blocks them from making critical financial decisions.
 Once your KPI data comes from a single source, lock down who can change the definitions, the chart of accounts mappings, and the calculation rules or the value of your diminishes if entity team apply local overrides without an audit trail.
5. Build continuous data flows with AI-native validation
Manual data extraction and batch cycles create reporting latency, compromising real-time oversight of enterprise capital. By connecting systems like bank feeds, billing tools, and project systems across each entity, data flows automatically into your reporting layer instead of being pulled together manually at close.
Intuit Enterprise Suite's AI agents validate transactions as they enter, alert teams to exceptions, and route them for review, ensuring the data reaching your KPI dashboards has already undergone a quality check.
Live data feeds backed by AI validation mean KPI reporting is a continuous, reliable source you can access in real time, not a monthly snapshot that's already out of date by the time it reaches the board.
KPI example: FP&A time allocation. Measure the percentage of your finance team's time spent collecting and validating data versus analyzing it. The FP&A Trends Survey found that only 35% of FP&A time goes to high-value work like generating insights. If your team's ratio is similar, automation is the fastest way to shift it.
6. Analyze with real-time variance analysis
The value of KPI data drops the longer it takes to reach you. The traditional close cycle takes time to complete as numbers need to be reconciled and consolidated before sign-off. By that point, the deviation from target may be weeks or months old and unsalvageable for the period.
AI-powered variance detection, when connected to live transactional data, significantly shortens that gap by alerting finance teams to KPI variances as they appear. For example, if entity-level margins on a project are trending below forecast, the variance is visible in real time rather than showing up at month-end. For example, when you use Intuit Enterprise Suite’s project accounting to track costs at that level, its Finance Agent can alert finance to the deviation before it grows.
By reducing the gap in reporting, you see where performance is under target sooner while the data is current enough to be useful.
KPI example: Operating margin variance by entity. A margin miss in one entity distorts the group result and weakens the numbers you present to the board. Review entity-level operating margin against forecast each period and investigate any variance above your materiality threshold before the close. A Gartner survey found that 66% of finance leaders see variance explanation as the area where AI will have its most immediate impact.
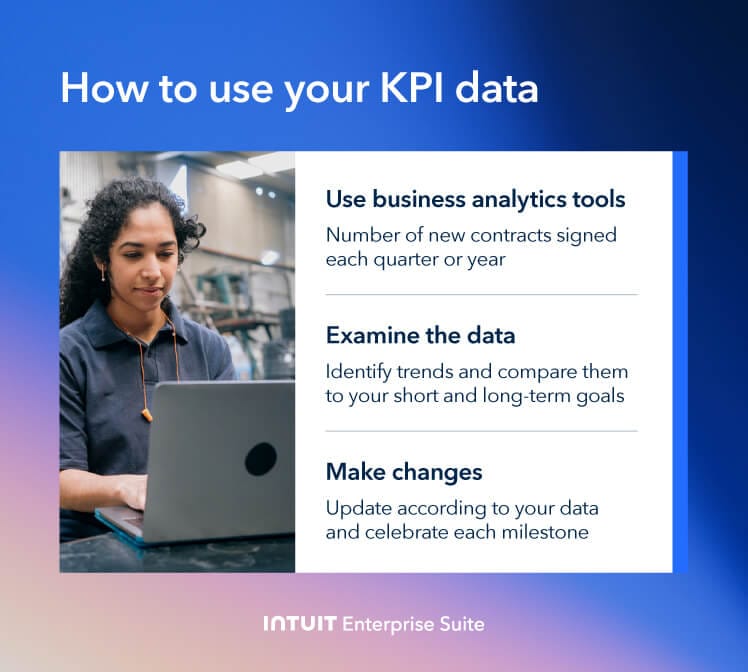
7. Use your KPIs to take action
You assign ownership of each KPI to a specific person and hold them accountable when performance drifts from target. But the root cause of a miss may be the decisions of actions in a different department from the one that owns the metric.
For example, a margin miss on a project often traces back to labor allocation decisions, while a customer paying later than the agreed-upon terms is responsible for a cash miss.
Your job is to trace the miss back to the team or function responsible and decide whether to correct course or adjust the forecast. A connected ERP gives you the audit trail to do that. Intuit Enterprise Suite's AI agents accelerate the process by alerting your teams to changes in affected projects and entities and suggesting responses based on the data behind the variance.
When you have a breakdown of what's underperformed and why, you can go directly to the person responsible and agree on what needs to happen to close the gap.
KPI example: Days sales outstanding (DSO). Track DSO at the entity and customer level each period. When DSO rises, trace it back to the specific customers or entities responsible and decide whether to tighten terms, escalate collections, or adjust your cash forecast to reflect the later inflow. A PYMNTS and American Express study found that businesses relying on manual AR processes have 30% longer DSO than those using automation.
8. Recalibrate with KPIs during M&A and structural scaling
As the business grows, the KPIs you previously relied on to measure performance may no longer reflect where value is created or where risk is concentrated. Review and refine your KPIs regularly to assess their suitability to your enterprise strategy and relevance to current operating conditions.

Compare your current performance against the baselines you established when you set the current KPIs. If the company rarely or never misses a particular KPI, question whether it’s at the right level or belongs on your ERP dashboard.
For KPIs the company regularly misses, consider whether the KPI was set at an achievable benchmark or if it needs to change to reflect, for example, different cost bases, customer mix, or market conditions.
By setting KPIs at the right level for the business as it is today, you uncover where performance is genuinely strong and which entities and projects need closer scrutiny.
KPI example: Inventory turnover. A KPI that may not have been on your dashboard when the group was purely services-based but becomes critical the moment you acquire an entity that holds stock. Review your KPI set after every acquisition or reorganization to check whether the metrics still match where capital is tied up. Use inventory analysis methods like GMROI to assess whether inventory is earning its cost of capital.
9. Establish governance and best practices
KPI governance determines who can define, modify, and access KPIs across the business. Without group-level ownership, entity leads may apply different rules to the same metric, and local finance teams may build reports from their own sets of inputs. When consolidated, the figures lack consistency and fail to win C-suite confidence.
Here's a framework for getting KPI governance right:
Strong governance, backed by advanced reporting that controls access by role, lets you present KPIs to the board knowing that every entity calculated them the same way and that the calculations haven't been altered without an audit trail.
How AI-native systems transform KPI tracking
The nine key performance indicators examples above outline how to accurately measure performance across a multi-entity business. Intuit Enterprise Suite is built to shorten the gap between data and decision-making. Where traditional ERP systems depend on batch processing and periodic closes, Intuit Enterprise Suite's AI-native architecture delivers continuous KPI reporting from live transactional data.

Real-time performance visibility
Connected AI-native systems like Intuit Enterprise Suite update revenue, margin, cash flow, and operational metrics continuously from live transactional data. Reviewing KPI performance no longer depends on the reporting calendar.

Automated multi-entity tracking
So, when board members ask whether the group is on track against its KPI targets, the answer comes from current, reconciled data rather than last month's close.
Intuit Enterprise Suite’s centralized ERP architecture standardizes KPI tracking across subsidiaries using a single chart of accounts and consistent recognition rules. Intercompany transactions are automatically reconciled and eliminated, so the consolidated view is not distorted by internal activity between subsidiaries.

You get a portfolio-level view across multiple entities in real time. You compare KPI performance across entities, regions, or business lines, knowing the calculations are consistent and based on the same underlying rules, and drill down from the group level into any entity without waiting for a report or switching systems.
AI-driven anomaly detection
The AI Agents in Intuit Enterprise Suite alert finance teams to real-time anomalies, such as margin shifts, expense spikes, and cash flow inconsistencies. The difference from standard threshold alerts is that AI learns from historical patterns across the group.
Instead of waiting for a KPI to miss its target, the agents identify when a trend is developing that, if left unchecked, will result in a miss. That gives you time to investigate and act before the number moves off target.
Continuous anomaly monitoring means you present KPI results to the board knowing the data has been stress-tested throughout the period, not just at close.

When you schedule a demo, you agree to permit Intuit to use the information provided to contact you about Intuit Enterprise Suite and other related Intuit products and services. Your information will be processed as described in our Global Privacy Statement.
Measure KPIs with confidence across every entity
Building a consistent KPI framework across a multi-entity group takes real work in standardization, governance, and data infrastructure. The payoff is that every close, forecast, and board report runs from one set of numbers that the whole group trusts.
Intuit Enterprise Suite centralizes KPI data across all entities, continuously updates it from live transactions, and uses AI agents to alert your teams to variances before they reach the board pack.
To find out how Intuit Enterprise Suite handles business intelligence KPI tracking across your group, book a call with one of our consultants to walk through your requirements and get a tailored demo.
Check out upcoming events and learn more about Intuit Enterprise Suite.

Customer stories

Case Study
How FEFA Financial is growing with Intuit Enterprise Suite—without migrating to an ERP

Case Study
How this mission-driven, employee-owned company created efficiencies with Intuit Enterprise Suite
October 25, 2024

Case Study
Why this camping business chose Intuit Enterprise Suite over NetSuite
October 25, 2024

Construction
Migrating to Intuit Enterprise Suite took 2 hours (with zero disruption) for this aspiring $50M revenue business
April 25, 2025

Case Study
Humble House Foods case study: How they improved visibility & simplicity using Intuit Enterprise Suite
September 24, 2025
More on business intelligence

Business Intelligence
Enterprise business intelligence: How to give CFOs a complete forecasting view using enterprise BI

Business Intelligence
How to measure KPIs: 9 steps to increase enterprise business performance

Business Intelligence