Table of contents
Table of contents
Manual data entry remains a primary driver of forecasting friction, with 59% of respondents in an Intuit Business Solutions Survey reporting significant impacts on operational efficiency. For finance teams managing complex entities, these manual bottlenecks do more than slow down workflows—they create weekly liquidity blind spots that obscure the firm's true cash position.
A rolling 13-week cash flow forecast, powered by business process automation, provides the real-time visibility necessary to manage these risks. While manual processes may suffice for basic oversight, they lack the precision required for audit readiness and strategic capital allocation.
In this article, we’ll help you understand what a cash flow forecast is and why you should adopt an AI-powered financial management tool for your business.

What is a 13-week cash flow forecast?
A 13-week cash flow forecast provides a 90-day window into weekly liquidity fluctuations. Finance leaders use this model to automate cash projections and maintain visibility into working capital across entities, ensuring sufficient liquidity for upcoming operational needs.
It’s a helpful model for managing short-term liquidity, and you can refer to it when making decisions about payroll, payments, and investment opportunities. It is also a one-stop archive for your financial backlog, which is handy during an audit or cash reconciliation.
This type of forecast is also ideal for looking ahead weekly from one fiscal quarter to the next. A rolling 13-week cash flow forecast is long enough to identify payments due in the coming weeks, while short enough to project receivable and payable cycles.
 An Intuit survey found that 48% of respondents report manual data entry is negatively impacting the timely reporting of financial information.
Why does the 13-week model matter for CFOs?
The 13-week model provides the optimal balance between immediate liquidity oversight and quarterly financial planning. This horizon enables CFOs to align weekly-end cash positions with broader fiscal goals, ensuring the firm maintains sufficient net cash flow.
A shorter window can work, but it would lack long-term projections that can inform growth opportunities. The 13-week cash flow forecast provides you with monthly horizons and the granularity of weekly outlooks.
Here’s a brief glance at what goes into a cash flow forecast:
- Starting cash balance: Your cash balance at the beginning of the 13 weeks
- Cash inflows: All expected weekly receipts, including accounts receivable collections, sales, and financing payments
- Cash outflows: All expected weekly disbursements, including accounts payable payments, payroll, rent, taxes, and loan payments
- Net cash flow: The projected difference between your cash inflow and cash outflow, which will show you whether your business has a surplus or a deficit
- Ending cash balance: The projected cash balance at the end of each week
5 steps to building a 13-week forecast
Manual data aggregation creates a high-risk bottleneck for finance teams. The 2024 Intuit QuickBooks Business Solutions Survey revealed that 91% of executives struggle with manual processes, spending an average of 25 hours per week on data entry. For a CFO, this latency hides timing gaps and transforms manageable variances into liquidity crises.
A 13-week forecast replaces reactive reporting with proactive oversight. Automating these data flows allows you to identify cash shortfalls weeks in advance, enabling strategic adjustments to disbursement schedules and credit utilization.
Follow these five steps to build a model that bridges the gap between collections and obligations across your entire entity structure:
Step 1: Establish the automated baseline
Setting up an automated baseline is a critical first step because it pulls data from your accounts and provides projections based on your account history.
If you have different bank accounts for raw materials purchases from different vendors, it will be difficult to manually input and track those payments from one week to the next. It will be even more difficult to project future expenses without historical purchasing data. An automated cash flow baseline will process all these numbers for you and provide precise estimates of future inflows and outflows.
Action: Automatically pull reliable data from accounting reports, including your starting cash balance from all operational bank accounts. From there, integrate:
- Accounts payable aging reports to populate future vendor payments
- Accounts receivable aging reports to project customer collections based on historical payment behavior
On average, businesses spend roughly 25 hours per week on manual data entry. Business process automation s about saving time, which is an increasingly valuable resource.
Step 2: Integrate fixed and variable outflows
Your integrated fixed and variable weekly expenditures will build on your automated baseline to provide accurate projections of all cash outflows for the 13 weeks. This consolidates your predictable and potential spending into your forecast while maintaining them as separate.
Distinguishing between fixed and variable spending will help you understand how much your business is spending or plans to spend. It can also help you understand how that spending lowers your current baseline or offsets your cash inflows.
- Fixed outflows: Payroll, rent, insurance, and recurring debt service payments
- Variable outflows: Nonrecurring payments like inventory purchases, marketing spend, and potential capital expenditures
The below chart shows weeks one through four of a cash flow forecast that only includes cash outflows. It presents a weekly fixed outflow of $150,000 and variable outflows in weeks 3 and 4, represented by a manufacturing materials purchase and a tax payment, respectively.
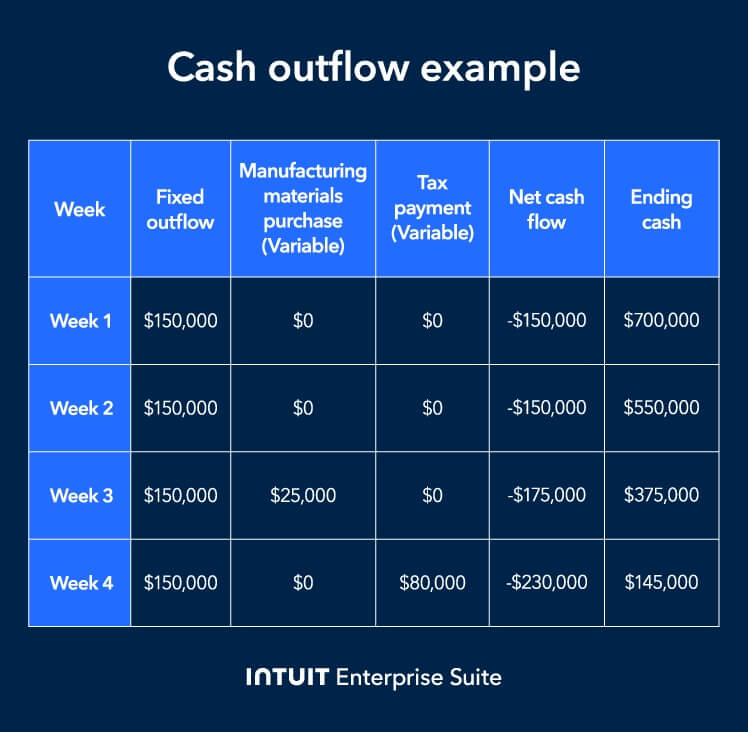
The variable outflows are categorized separately but are additive to the fixed outflows because they impact your net cash flow and ending cash.
Action: Aggregate your firm-wide expenditures and categorize them based on their impact on liquidity. Start by hard-coding fixed obligations—such as payroll, rent, and debt service—into your weekly baseline to establish your total burn rate.
Step 3: Project discretionary and strategic inflows
Historical data over a 2-year period or longer can help model seasonal fluctuations in sales, like holiday spikes, summer slowdowns, or other trends to inform your weekly financial projections. The idea is to integrate all your financial metrics into a connected system and a forecast chart you can read and analyze easily.
Enterprise resource planning (ERP) systems can help you consolidate real-time financial and inventory data in a unified dashboard that shapes your rolling 13-week forecast. This data will give you precise estimates about where your business is headed during times of volatility.
For example, suppose your manufacturing company just landed a large, unexpected order that you plan to fulfill within the next 10 weeks. To forecast how this will impact the financial outlook of your 13-week cash flow calendar, you’d estimate the cost of materials from each vendor and project cash inflows that will result from fulfilling this order.
Action: Leverage historical data—ideally spanning 24 months or more—to model seasonal trends and integrate these projections with real-time sales data for a more accurate rolling 13-week forecast.
Among respondents to the Intuit Business Solutions Survey, 95% agree that integration between various apps and software is essential.
Step 4: Model strategic what-if scenarios
Scenario planning gives a snapshot of what to anticipate in the future of your business—so you can understand all possible outcomes and plan ahead. This includes things like new hires, delayed payments, inventory purchases, and other variables.
You can evaluate uncertainty by inputting potential downsides, such as:
- Low sales
- Delayed payments
- Unexpected operational costs
Also, you can forecast growth for a new product or service, which can help you refine ideas and identify areas to expand your business offerings.
A good use of “what if” forecasting would be evaluating the impact of risk in construction projects, which are most likely to face delays or go over budget. By adjusting your 13-week forecast to account for these variables, you can see exactly how a 10% cost overrun would impact your total liquidity.
This allows you to secure contingency funding or adjust other project timelines before a cash shortfall affects your operations.
Action: Use scenario modeling to instantly assess the risk of strategic decisions on your weekly ending balance or overall project outcome. To execute this, adjust your 13-week forecast parameters to reflect specific "downside" variables—such as a 15% delay in receivables—to see the immediate impact on your projected liquidity.
Step 5: Execute mitigation and review weekly
Updating your projections with the actuals and adding a 13th week every week will keep you on top of your financial expectations. It might seem like a chore, but reviewing your forecast and rolling it forward weekly maintains accuracy.
Your forecast is a living document that drives actionable decisions. Without review, you won’t know when to act or if you need to take steps to mitigate a negative cash week. Weekly review and mitigation are especially crucial in industries like manufacturing, where inventory control has a direct impact on your cash flow.
Action: Conduct a weekly reconciliation by rolling the forecast forward and replacing previous projections with actual cash results to maintain 90-day visibility.
For any week where projected ending cash falls below your required threshold, initiate immediate mitigation using one of the following strategies:
- Accelerate accounts receivable collections
- Draw down a credit line
- Delay non-critical accounts payable payments

Strategic applications beyond crisis management
Beyond day-to-day liquidity monitoring, the 13-week forecast provides the quantitative evidence required to manage external stakeholder relationships and optimize capital structure.
Here are some of the most critical strategic applications of the 13-week cash flow forecast:

Proactive tax and expense management
The 13-week forecast can help you identify a surplus in future weeks, which positions you to make informed financial decisions. You can time large expenses in advance, pay vendor invoices early to capture discounts, or accelerate tax payments for deductions.
In its Total Projected Economic Impact™ study of IES, Forrester Consulting found that Intuit Enterprise Suite had a 3-year value of $18,782 for accounting tasks. Automated invoicing expedited payment schedules and offered a more accurate snapshot of a business’s financial data while saving time.
Forrester also reports that bookkeepers saved between 50% and 95% of the time previously spent on invoicing. Plus, increased visibility into project forecasting led to better decision-making and budget allocation. Modeling scenarios enables CFOs to make informed decisions, one of the reasons why you would want a forecast.
Forrester found that better decision-making held a potential value of $238,738. “What if” scenario modelling can help you realize this value by helping you make informed decisions.
Securing short-term financing
A well-managed cash flow forecast is a powerful communication tool when negotiating with lenders and investors. It demonstrates financial governance and credibility, and it represents your business as a focused unit that prioritizes organization and efficiency.
In its study of Intuit Enterprise Suite, Forrester Consulting found that standardized systems and data transparency improved collaboration within departments and reduced risks such as data breaches or data-entry errors. If your teams are operating more efficiently and without error, you’re inspiring confidence in your business that investors like to see.
The study also found that consolidated, automated payroll systems were worth up to $118,000 over three years. This will show creditors and lenders that their money is funding a business that values time-saving processes and efficiency.
Managing seasonal and cyclical risk
A cash flow forecast enables you to maintain stability for your business by modeling predictable outcomes using “what If” scenarios and accounting for seasonality or other risks. You can plan for inventory and payroll accumulations during peak seasons and manage the cash lag during slower periods.
Data and insights, like those you can find in a cash flow forecast, help companies retain revenue. Forrester Consulting found in its study that informed business decisions were worth between $149,000 and $239,000 over a three-year period. Your data consolidated in one place also means you won’t be manually handling it as frequently, which reduces the risk of a potential data breach or data entry error.

When you schedule a demo, you agree to permit Intuit to use the information provided to contact you about Intuit Enterprise Suite and other related Intuit products and services. Your information will be processed as described in our Global Privacy Statement.
Boost productivity and enhance profitability
A 13-week cash flow forecast acts as an early warning system, providing the lead time necessary to resolve timing gaps before they stress the balance sheet. For multi-entity firms, this visibility enables finance leaders to address liquidity risks across all subsidiaries in real time.
Shifting from reactive reporting to proactive capital management requires projections grounded in real data. Intuit Enterprise Suite helps finance leaders access that data by automating the 13-week cash view—and eliminating the friction of manual multi-entity consolidation.
Check out upcoming events and learn more about Intuit Enterprise Suite.

Customer stories

Case Study
How FEFA Financial is growing with Intuit Enterprise Suite—without migrating to an ERP

Case Study
How this mission-driven, employee-owned company created efficiencies with Intuit Enterprise Suite
October 25, 2024

Case Study
Why this camping business chose Intuit Enterprise Suite over NetSuite
October 25, 2024

Case Study
Migrating to Intuit Enterprise Suite took 2 hours (with zero disruption) for this aspiring $50M revenue business
April 25, 2025

Case Study
Humble House Foods case study: How they improved visibility & simplicity using Intuit Enterprise Suite
September 24, 2025